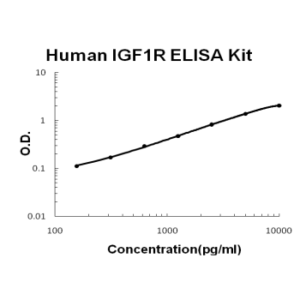
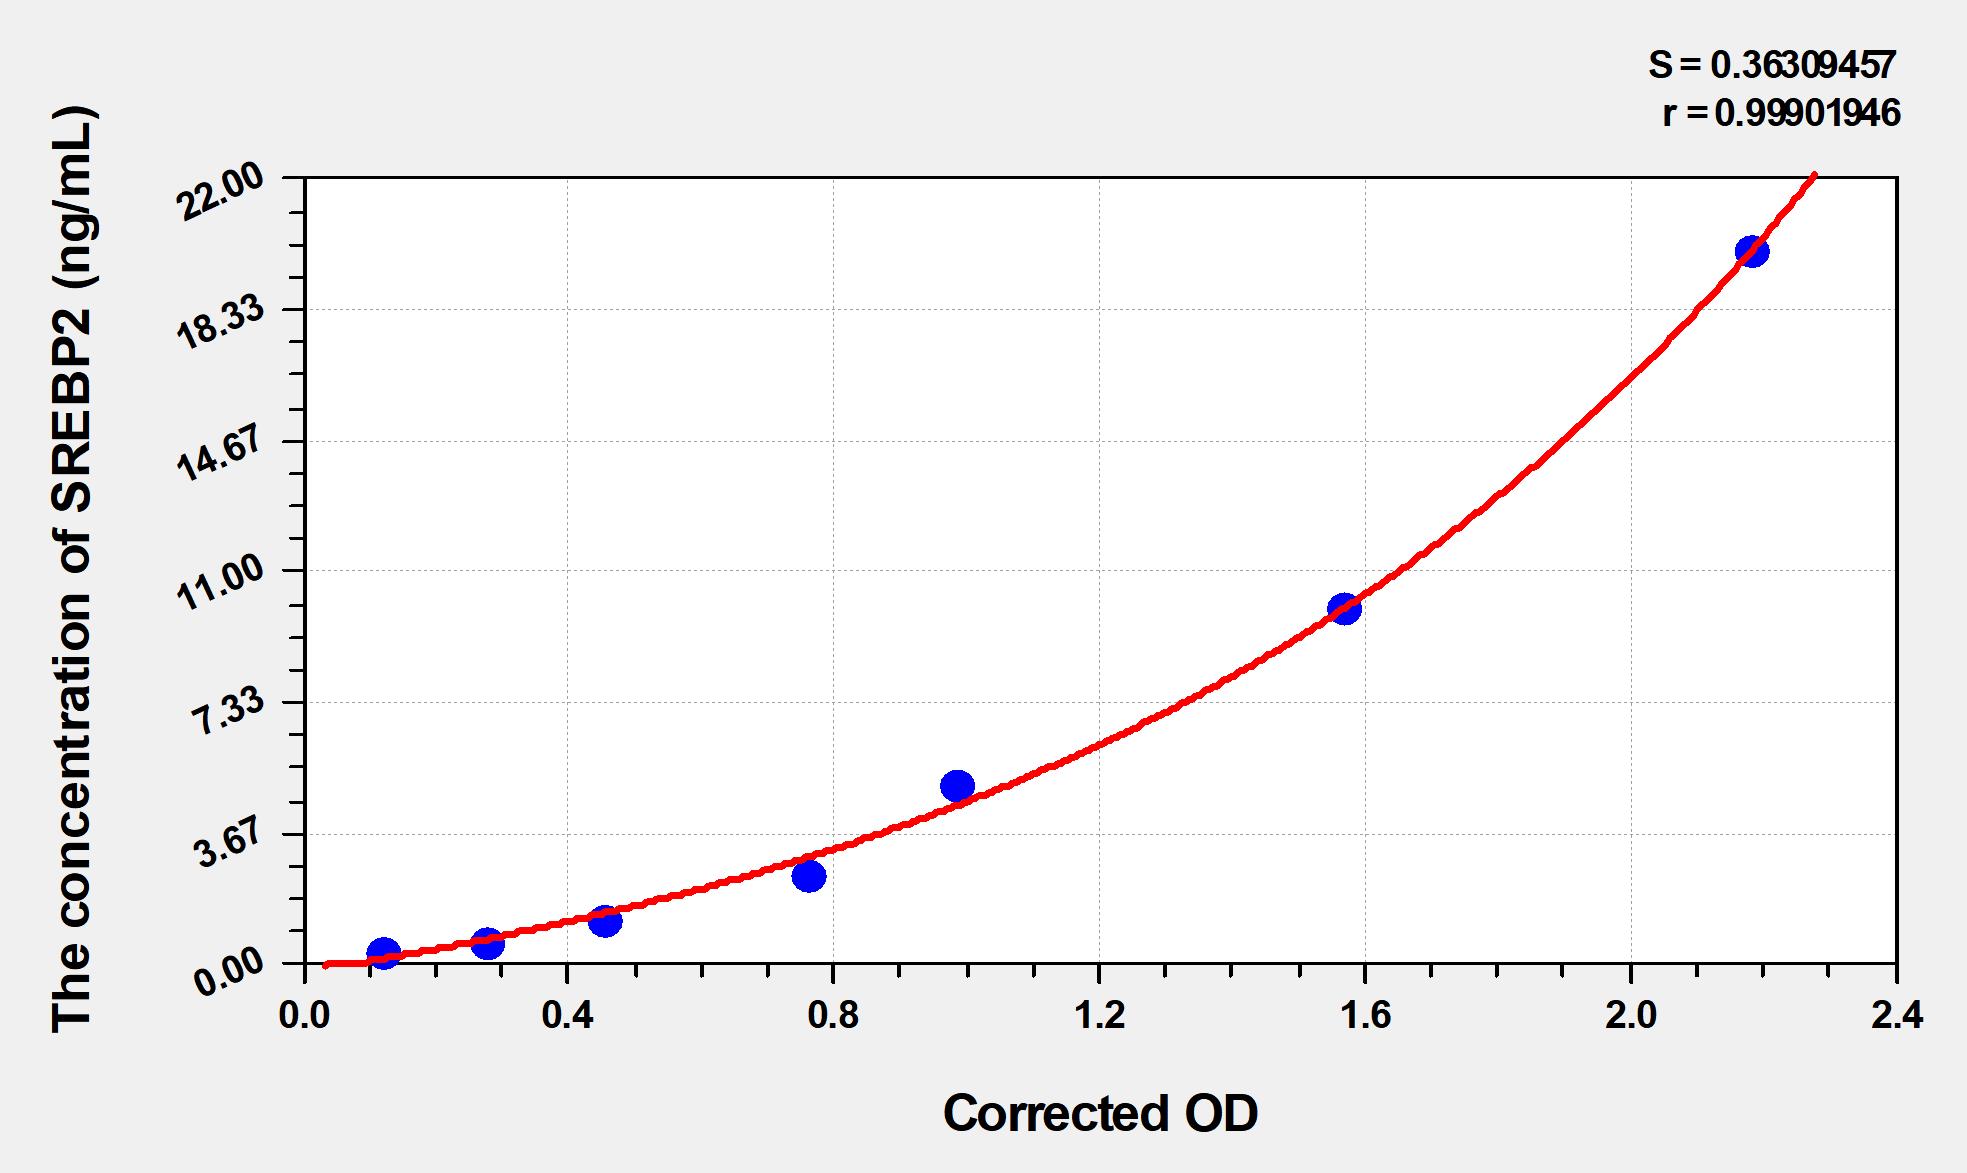
Standard curve
| Concentration (ng/mL) | OD | Corrected OD |
|---|---|---|
| 20.00 | 2.258 | 2.169 |
| 10.00 | 1.647 | 1.558 |
| 5.00 | 1.069 | 0.980 |
| 2.50 | 0.847 | 0.758 |
| 1.25 | 0.541 | 0.452 |
| 0.63 | 0.368 | 0.279 |
| 0.32 | 0.213 | 0.124 |
| 0.00 | 0.089 | 0.000 |
Precision
Intra-assay Precision (Precision within an assay):CV%<8%
Three samples of known concentration were tested twenty times on one plate to assess intra-assay precision.
Inter-assay Precision (Precision between assays):CV%<10%
Three samples of known concentration were tested in forty separate assays to assess inter-assay precision.
Recovery
| Matrix | Recovery range | Average |
|---|---|---|
| serum(n=5) | 86-99% | 92% |
| EDTA plasma(n=5) | 83-95% | 89% |
| Heparin plasma(n=5) | 80-95% | 87% |
Linearity
| Matrix | 1:2 | 1:4 | 1:8 | 1:16 |
|---|---|---|---|---|
| serum(n=5) | 91-98% | 79-93% | 92-101% | 82-90% |
| EDTA plasma(n=5) | 79-91% | 89-103% | 82-95% | 86-99% |
| Heparin plasma(n=5) | 88-103% | 83-94% | 92-105% | 89-97% |
